
Prime Minister PolicyMaker 😁


Time ⏳: 45 mins
Background :
Policymakers are people who are responsible for formulating policies and making policy decisions. UN has come up with 17 Sustainable development goals across domains with around 167 targets to transform the world. And it is upon policymakers, government officials, researchers, and data scientists to help achieve these sustainable targets by identifying key problem areas and their factors, collecting, processing, and analyzing relevant historic and current data to provide necessary insights to make informed decisions by designing policies for sustainable development.
Karnataka Data Lake is an ongoing project serving as the Data Analytics partner for the Department of Planning and Statistics, Karnataka.
This activity brings you an exciting opportunity to be a Policymaker for a day
If you’ve made a PolicyMaker for a day 🤔, how do you approach, understand and resolve the problem? 🧐 What policy and budget decisions will you make to build a sustainable society and achieve an SDG target? 🤓
The Task :
The activity requires participants to be divided among groups.
Each group is presented with a problem statement for a region. Considering the data and analysis provided by the KDL site or any other sources, the team should design the policies to help achieve the UN’s Sustainable development target not limited to the below questions but can be based on your expertise.
By the end of the activity, each group should present a case study by performing the below tasks ✅
- Explain the problem statement, its relevant SDG Target, and the Karnataka context for the given target.
- Investigate factors leading to the problem. Observe if there is a pattern w.r.t the district’s neighboring regions.
- If you are given a budget of 20 crores / 2 Million to reach the SDG target for the district. How will you allocate the budget for improving different factors leading to the problem?
- Based on your analysis so far, please suggest policies/schemes/action items that help improve the factors affecting the problem sustainably.
- Present your case study (ppt or doc) with relevant references, visualizations (optional), dashboards (optional), and datasets (optional) and justify your budget and policy decisions.
(A sample Example is provided for reference purposes.)
References :
- Karnataka Data Lake Dashboard Gallery: Analysts can identify and observe the trends/patterns in the data or join datasets from different departments to get a bigger picture in solving a problem. Karnataka Data Lake’s pre-module on Exploratory Data Analytics provides initial reports, observations, and correlations from user-selected datasets and has the ability to perform real-time analysis using AI/ML models.
- Karnataka Data Stories Page : Users can utilize Karnataka Data Lake with a focus on intervention modeling and counterfactual analysis to understand potential causes that provide clues on how, when, and where to intervene with policy instruments so as to achieve targets/goals in the best possible way.
- Open Source Karnataka Data can be found in KODI, OpenCity.
- Karnataka Open Data and Analytics Platform: KADAP
- Karnataka SDG Dashboard can be accessed here : Avalokana SDG Barometer
- Karnataka Malnutrition Dashboard can be accessed here : Avalokana Malnutrition Dashboard
- Government of Karnataka Website
- Sustainable development Goals in Karnataka Context

Please form groups based on your familiarity with the below SDG Goals. Through this activity, we would love to hear your group’s narratives in solving and achieving the SDG targets not limited to just using the dashboards, but any research papers/reports/news articles/personal or professional expertise.
(*Please note that our volunteers will be around in case of queries or if any help is required to solve/present the problem)
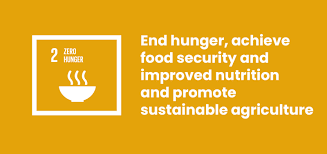
- Bidar district is reported to have less Rice production compared to the state’s average
- Koppal district has reported having less Wheat production compared to the state’s average.
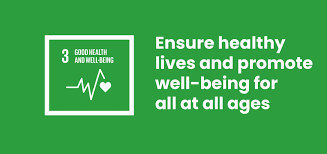
- Vijayanagar district has reported a high IMR compared to the state’s average.
- Haveri district reported a high MMR compared to the state’s average.
- Kalburgi district reported high U5MR compared to the state’s average.
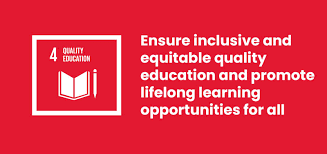
- Vijayanagar district reported high secondary dropouts compared to the state’s average.
- Shivmoga district reported high girls’ dropout rate compared to the state’s average.