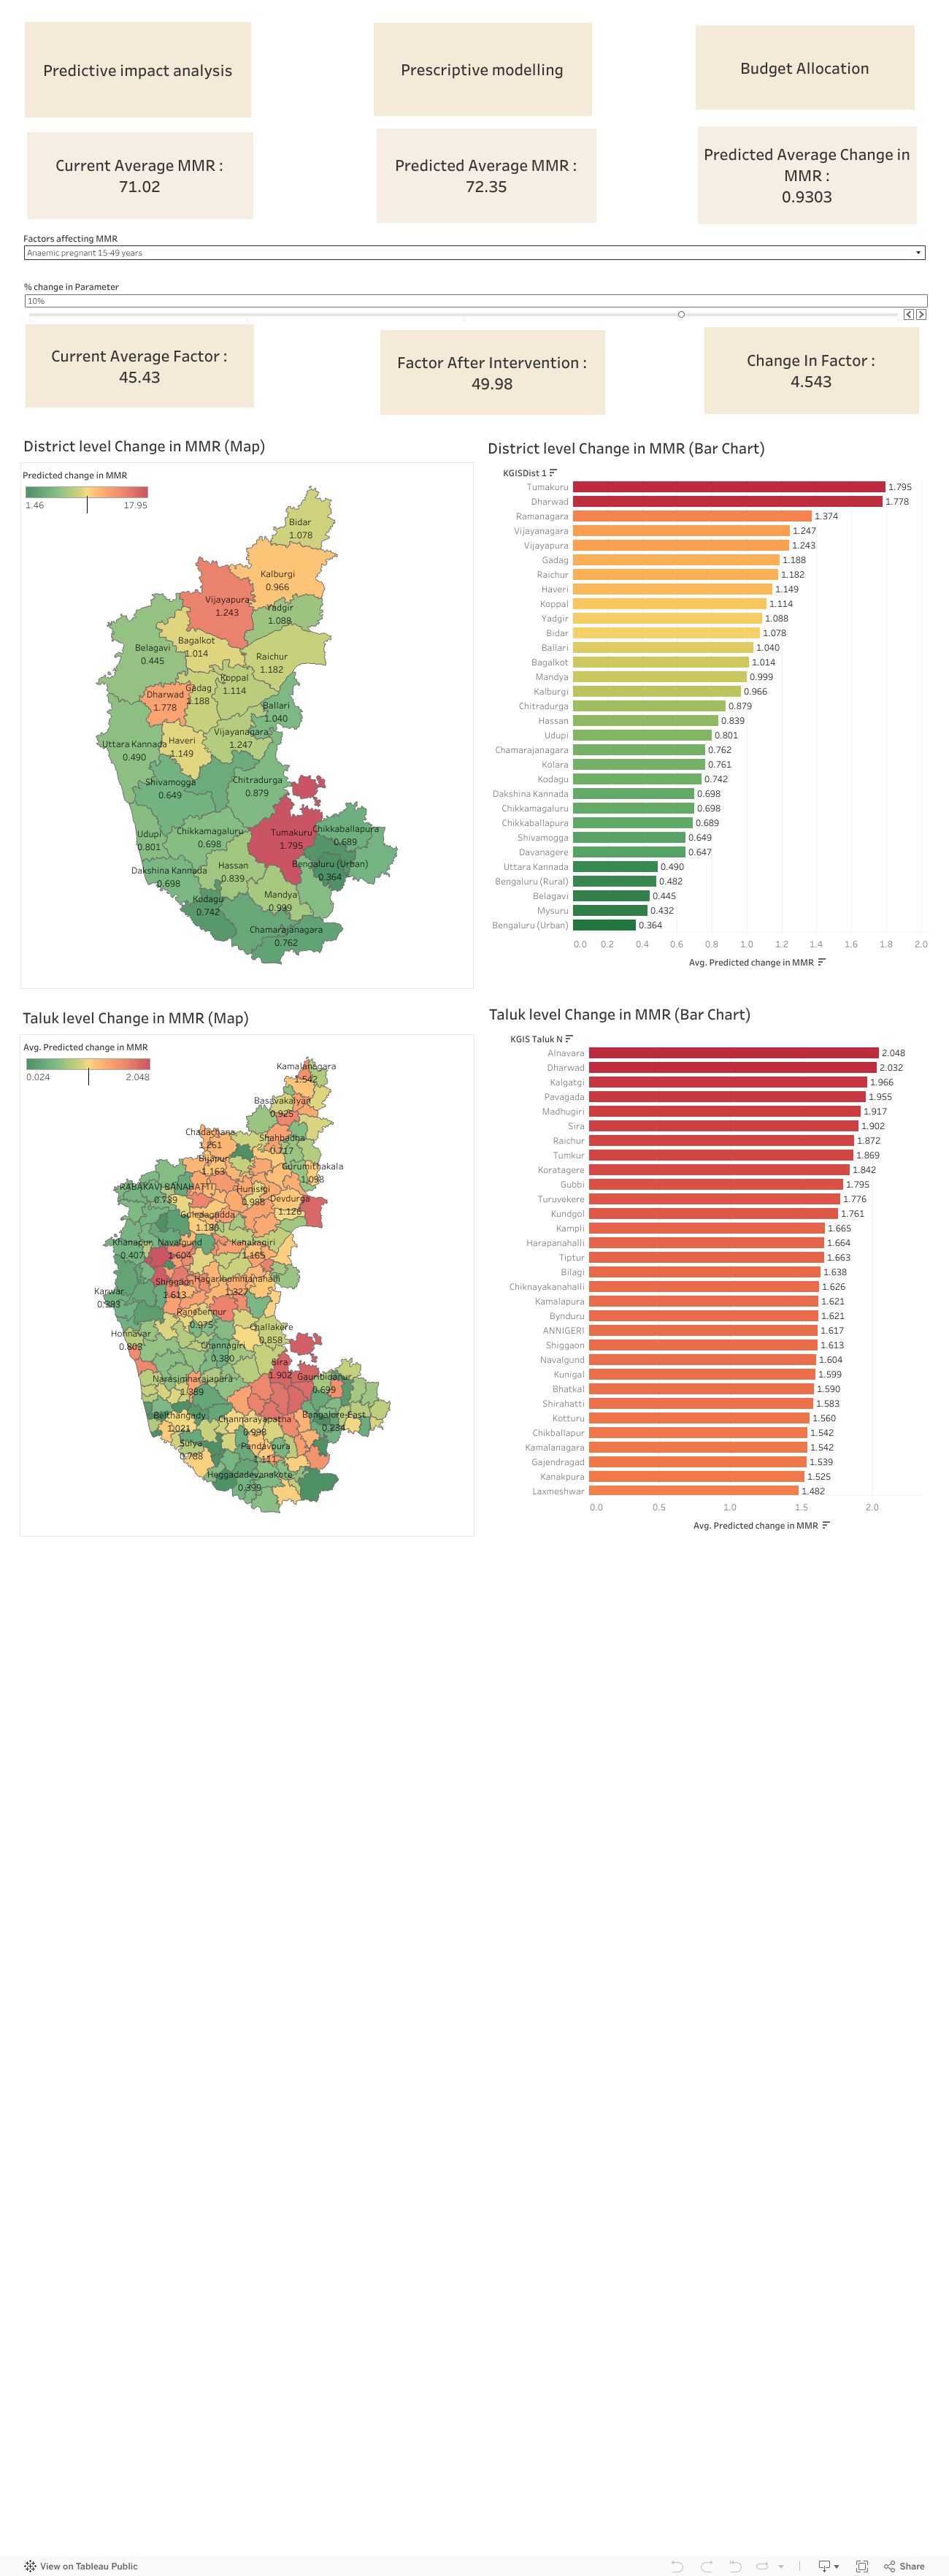
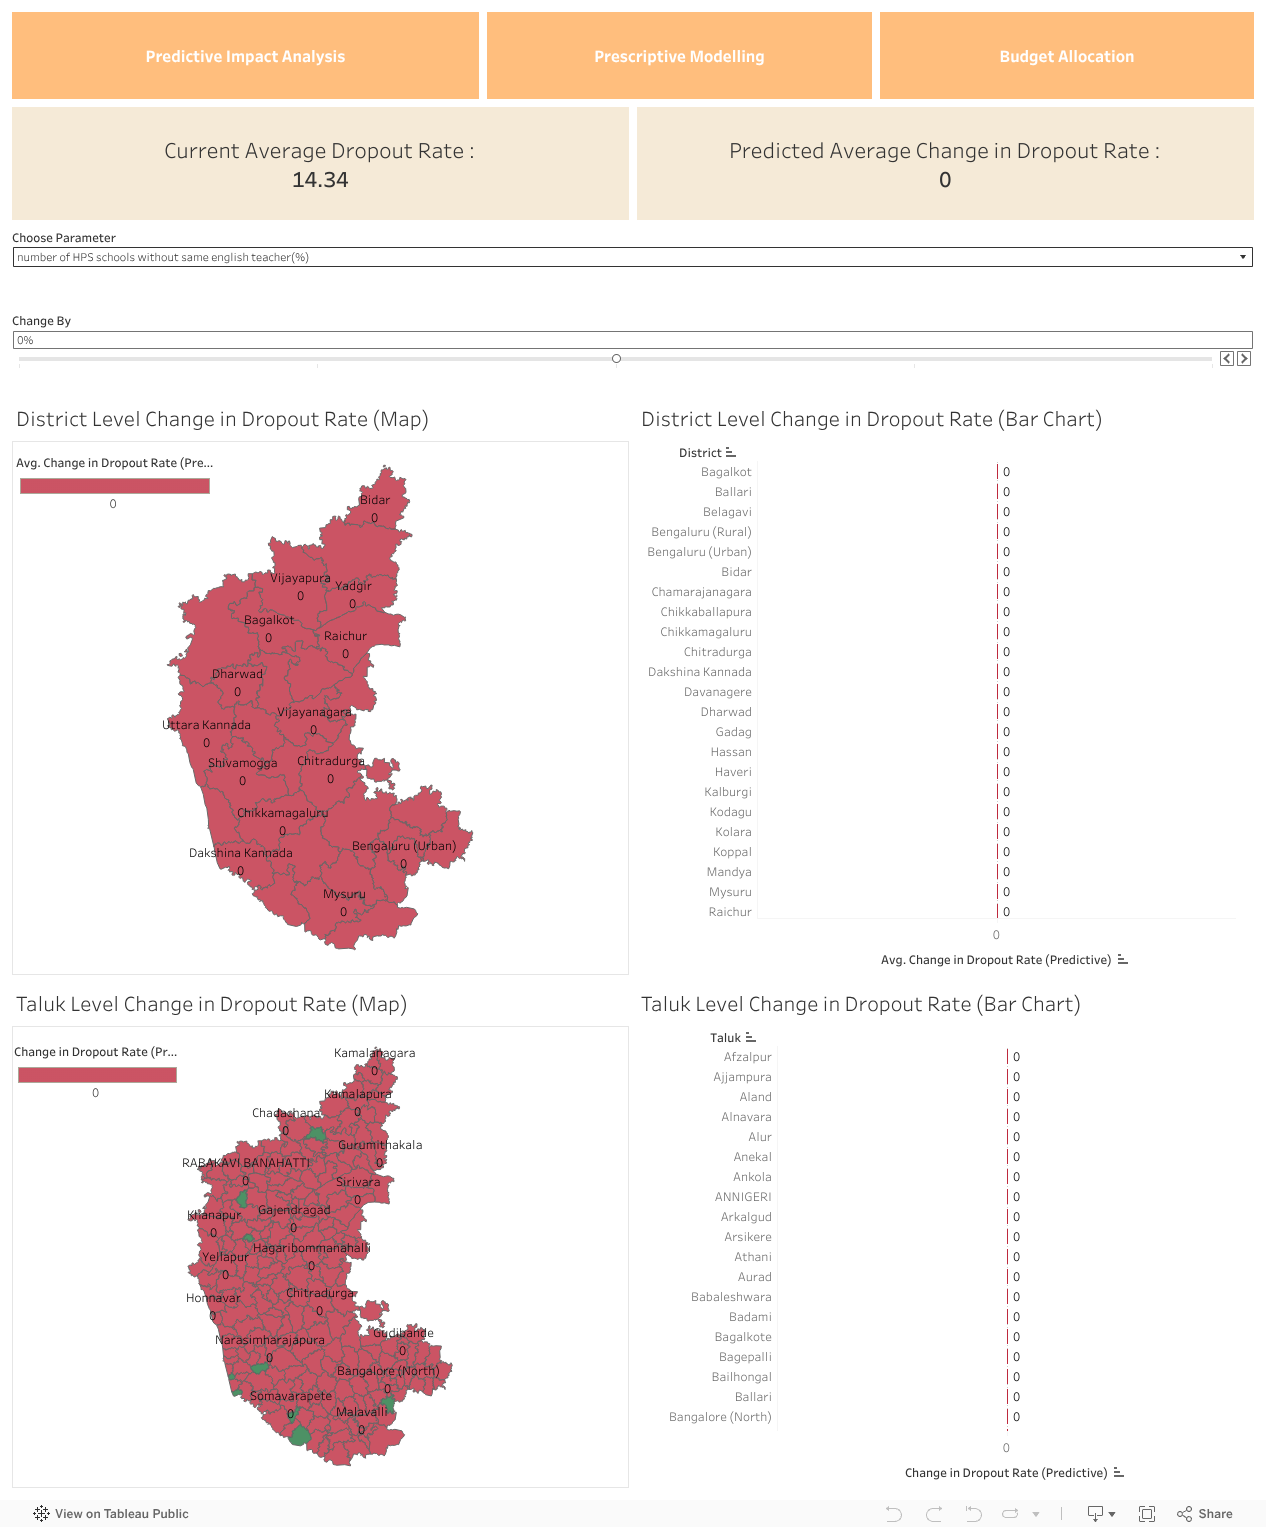
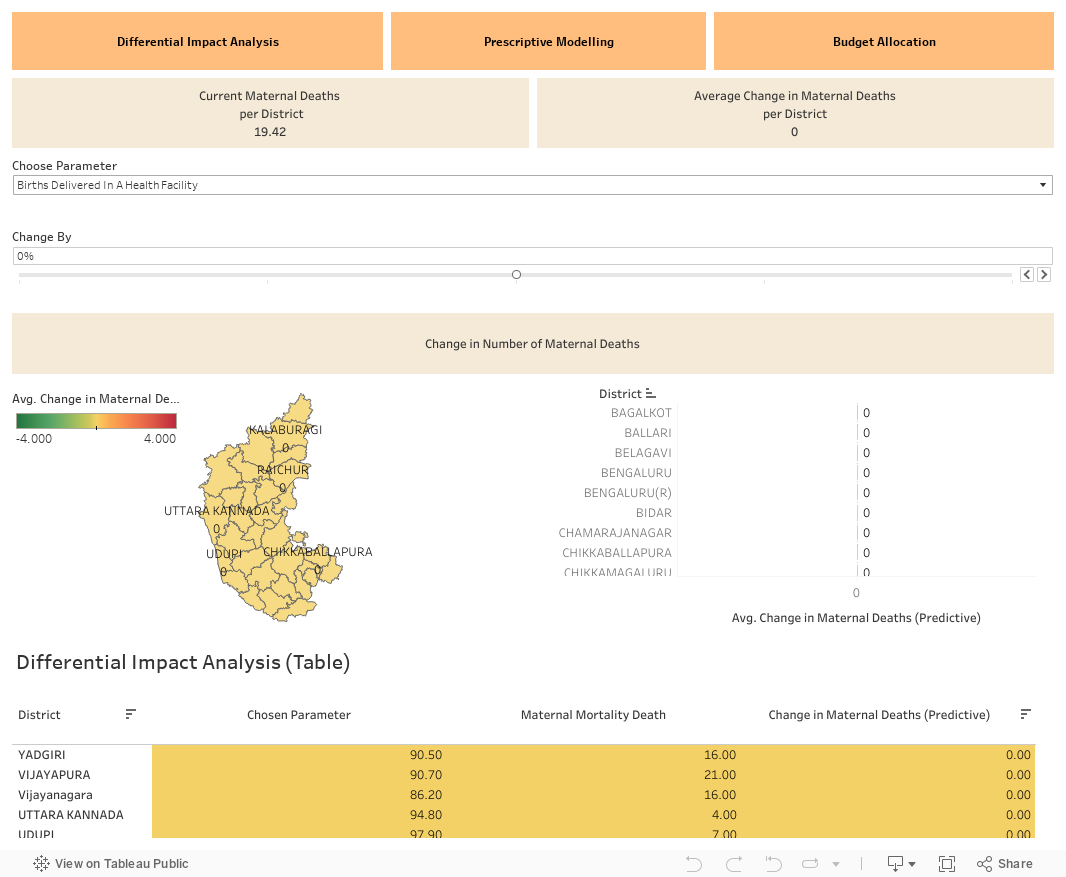
Intervention Dashboard – Maternal Deaths

There are 4 components to the below dashboard.

  1. Predictive Impact Analysis
  2. Prescriptive Modelling
  3. Stability Modelling
  4. Recommended Budget Allocation
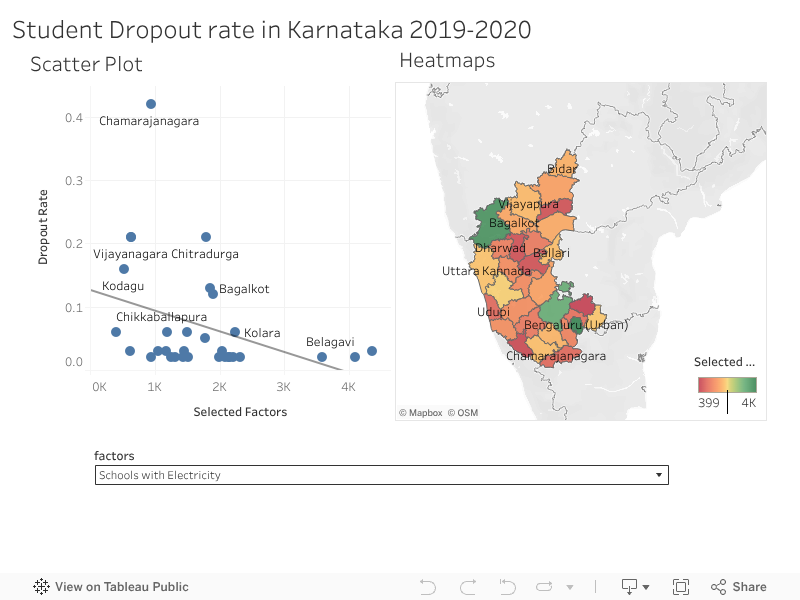
In Predictive Impact Analysis dashboard, we can see the impact of different factors on Maternal Deaths (MD). We can intervene on a factor by selecting it from the dropdown menu and change it by any amount (eg: +10% , -10% etc) and we can see the corresponding changes in MD at district level.

In Prescriptive modelling dashboard, we can set the target MD and the model outputs the prescribed values of different factors in order to achieve the specified target MD. We can also see the corresponding change in MD at the district level by adopting these prescribed values of the factor. We can also see sensitivities of different factors which talks about the importance of the factor and it ranges from 0 to 1. If a domain expert deems a specific factor as unimportant, they can assign a sensitivity value of 0. For factors considered partially important, a sensitivity value of 0.5 can be assigned. If the expert believes the factor unquestionably plays a role, they have the option to set its sensitivity to 1.

In the prescriptive modelling dashboard itself, there is a box displaying the state stability score after intervention. There is also a scatter plot showing the relation between impact and stability with districts represented as points.

Finally, the dashboard includes a feature for budget allocation. Positioned at the top is a pie chart derived from slopes obtained from multiple linear regression. The methodology systematically distributes the budget to address the requirements of various districts. Here, as well, we can see the sensitivities of the factors. If the policy maker/domain expert thinks that a particular factor plays no role, he can set its sensitivity value to 0 and the budget allocation model will automatically get re-adjusted.

CIKM 2023 Workshop on Enterprise Knowledge Graphs Using Large Language Models

22nd October 2023,University of Birmingham, UK

Contact Us

Rajeev Gupta (Principal scientist, Microsoft, India)
Microsoft R&D India Pvt. Ltd., Hyderabad, India
Email: rajeev.gupta@microsoft.com

CIKM 2023 Workshop on Enterprise Knowledge Graphs Using Large Language Models

22nd October 2023,University of Birmingham, UK

Programme Committee

  • Manoj Agarwal (Senior Researcher, Discovery Intelligence, Uber Research)
  • Manish Bhide (CTO, AI Governance, IBM)
  • Mukesh Mohania (Professor, CSE, IIIT Delhi)
  • Prasad Deshpande (Senior Staff Software Engineer, Databricks)
  • Qi He (Head of AI, Nextdoor)
  • Ranganath Kondapally (Principal Applied Scientist, Microsoft)
  • Rushi Bhatt (Partner, ML Systems and Services, Microsoft)
  • Sauvik Ghosh (Director of AI, LinkedIn)

Workshop Chairs

Website Chairs

CIKM 2023 Workshop on Enterprise Knowledge Graphs Using Large Language Models

22nd October 2023,University of Birmingham, UK

Workshop Schedule

Workshop Venue: Teaching and Learning Building (M208/M209) at the University of Birmingham (workshop venue).

The below schedule is based on UK time zone(UTC+1).

Session 1: 9.00-10.30

Introduction & Initial announcements: 9.00-9.30
Lessons from the age of user-generated content for the age of AI-generated content (Prof. Nishanth Sastry: 9.30 to 10.30 )
Refreshment Break: 10:30-11:00

Session 2: 11.00-12.30

Enhancing Enterprise Knowledge Base Construction with Fine-Tuned Generative Language Models (Liana Mikaelyan:11.00-11.45)
Research Session 1: 11.45 – 12:30
1. Related Table Search for Numeric data using Large Language Models and Enterprise Knowledge Graphs(Pranav Subramaniam, Udayan Khurana, Kavitha Srinivas and Horst Samulowitz)
2. Cognitive Retrieve: Empowering Document Retrieval with Semantics and Domain Specific Knowledge Graph(Apurva Kulkarni, Chandrashekar Ramanathan and Vinu E Venugopal)
Lunch: 12.30- 14.00

Session 3: 14:00- 15:30

Building Knowledge Graph for Products at Scale and infusing it into LLMs(Dr. Manoj Agarwal: : 14.00-14.45)
Research Session 2:(14.45 -15.30)
1. EduEmbedd – A Knowledge Graph Embedding for Education(Anurag Mohanty)
2. CRUSH: Cybersecurity Research using Universal LLMs and Semantic Hypernetworks (Mohit Sewak, Vamsi Emani and Annam Naresh)
Refreshment Break: 15.30 – 16.00

Session 4: 16.00- 17:00

LLMs for Social Networks: Applications, Challenges and Solutions (Bojan Babic: 16.00-17.00)

CIKM 2023 Workshop on Enterprise Knowledge Graphs Using Large Language Models

22nd October 2023,University of Birmingham, UK

Important Dates

Abstract Submission: 8th September 2023 Closed
Paper submission : 10th September 2023 Closed
Notification of paper acceptance : 25th September 2023 27th September 2023
Camera Ready Paper Submission : 1st October 2023
The workshop : 22nd October 2023

CIKM 2023 Workshop on Enterprise Knowledge Graphs Using Large Language Models

22nd October 2023,University of Birmingham, UK

Invited Talks

Lessons from the age of user-generated content for the age of AI-generated content

Prof. Nishanth Sastry, Director of Research of the Department of Computer Science, University of Surrey.

Abstract:

The past decade and more has been defined by the rise and near universal adoption of user-generated content (UGC) on social media. Initial excitement about the promise of UGC has since become tempered by concerns about misinformation, hate speech and other online harms. We are now witnessing a similar enthusiasm for content generated by Large Language Models. This talk will draw parallels between the two, and extract lessons about the perils, potentials and pitfalls awaiting us in the future age of AI-generated content.

Biography:

Prof. Nishanth Sastry is the Director of Research of the Department of Computer Science, University of Surrey. His research spans a number of topics relating to social media, content delivery and networking, and online safety and privacy. He is joint Head of the Distributed and Networked Systems Group and co-leads the Pan University Surrey Security Network. He is also a Surrey AI Fellow and a Visiting Researcher at the Alan Turing Institute, where he is a co-lead of the Social Data Science Special Interest Group.

Can machines discover new knowledge?

Dr. Fabio Petroni, Co-Founder & CTO at Samaya AI

Abstract:

For many years, the quest to determine the most efficacious representations of knowledge for machines has been at the forefront of research. Historically, this focus has centered on knowledge retrieval, whether from unstructured text corpora, structured collections (e.g, knowledge graphs, key-value memories), or the parameters of a neural model. How can we evolve these representations to not just retrieve, but actively discover new knowledge?

Biography:

Dr. Fabio Petroni is the Co-Founder & CTO at Samaya AI, building an AI-powered knowledge-discovery platform. Before that he was a Researcher at FAIR and Thomson Reuters, focusing on representing, gathering, extracting, using, reasoning on and creating world knowledge using AI.

Enhancing Enterprise Knowledge Base Construction with Fine-Tuned Generative Language Models

Ms. Liana Mikaelyan, Research Software Development Engineer in the Alexandria team, Microsoft Research Cambridge UK .

Abstract:

In this talk, we will present our latest work on leveraging the power of generative language models for knowledge base construction. We have fine-tuned a generative LLM to extract entities and their relevant properties from text passages and represent them in a structured JSON format. This task was accomplished by creating a dataset of short passages and corresponding JSON outputs using GPT4, which was then used to fine-tune the OpenLlama 3B model on a single A100 GPU. Our approach has demonstrated superior performance compared to the existing template matching algorithm in Alexandria, both in terms of precision and coverage, as well as extracting a richer set of properties from the text. Furthermore, the addition of new properties to the knowledge base has been significantly simplified. Future work involves exploring ways to improve the generation time as well as investigating other models to further enhance our system’s performance

Biography:

Ms. Liana Mikaelyan is a Research Software Development Engineer in the Alexandria team at Microsoft Research Cambridge UK . Before joining Microsoft Research Cambridge she worked on various machine learning projects mainly in speech synthesis and recognition. She completed her MSc in Machine Learning at UCL with a background in mathematics.

LLMs for Social Networks: Applications, Challenges and Solutions

Bojan Babic, Nextdoor.

Abstract:

Last couple of years we have witnessed an explosion of Generative AI research and respective applications that are simultaneously transforming how companies operate internally and how they communicate with their customers. 

In this talk we will present work of the Nextdoor GenAI team and respective LLM applications in social networks in the areas such as Knowledge tasks, Engagement tasks and Governance. We will cover what we have tried, what works and what does not work. At the same time, in this talk we will present a framework that we used that helped us iterate fast and systematically improve each of the product areas. 

Biography:

Bojan Babic is currently working on various Generative AI problems at the social media platform Nextdoor. Preceding this position, he has been working on the Search/Information Retrieval, Ads and recommendations and respective application spanning from e-commerce to social media space

Building Knowledge Graph for Products at Scale and infusing it in to LLMs

Dr. Manoj Agarwal,Senior Staff Engineer in Discovery Intelligence team at Uber AI.

Abstract:

 A knowledge graph is the key to entity search as it can store the factual entity related information in a structured manner without the rigidity of a fixed schema. Both Google and Bing have web scale knowledge graphs and for a large fraction of user queries knowledge graph is invoked. E-commerce search is primarily an entity search. Therefore, building a Knowledge Graph is the key to improve the eCommerce search in many ways. However, building it at web scale is a highly challenging problem. It is an equally or even more challenging problem to build the knowledge graph for products. In this talk, we present our methodology to build the knowledge graph for products at web scale. With recent success of LLMs, can we infuse such semantic understanding of the world, encoded in the form of Knowledge Graph, in the LLMs? There are some advances in this direction, however it remains an open question if the Knowledge graphs can be replaced by the LLMs.

Biography:

Dr. Manoj Agarwal is Senior Staff Engineer in Discovery Intelligence team at Uber AI. Before Uber, he was Principal Applied Scientist at Microsoft – AI and Research and a senior researcher in IBM Research.  Manoj was the chief architect for building a web scale product knowledge graph for Microsoft – Shopping, comprising a few hundred million products and a few billion facts with high accuracy. Currently, he is engaged in the efforts to build the scalable knowledge graph as well as discovering the taxonomy to improve the semantic search and recommendations for Uber Delivery. His research interests are in the areas of web mining, graph mining, pattern recognition, data mining, knowledge graphs, LLMs and information retrieval with more than 30 patents and over 25 research papers in reputed journals and conferences.

CIKM 2023 Workshop on Enterprise Knowledge Graphs Using Large Language Models

22nd October 2023,University of Birmingham, UK

Call For Papers

Knowledge graphs can integrate diverse data sources and provide a holistic view to the downstream applications. By virtue of being structured, knowledge graphs offer transparency and interpretability to the search and recommendations applications. Combining Knowledge Graphs with current-day advances in LLMs can create several opportunities.

The EKG-LLM workshop as part of CIKM 2023, would be addressing how large language models can help with the construction and usage of these enterprise knowledge graphs. This involves improving all the aspects of EKG workflow using large language models: entity extraction, entity enrichment, EKG construction, querying EKG for search and recommendations, scenario specific EKG, etc. Through this workshop we would like to highlight research issues specific to the integration of the enterprise knowledge graphs with large language models and associated applications.

Topics of interest include but are not limited to, the following:

  • Designing Enterprise Knowledge Graph (EKG)
  • EKG Implementation
  • Scalable extraction of enterprise entities using LLMs
  • Building EKGs for specific domains or applications
  • Natural Language Processing (NLP) algorithms to build EKGs.
  • Relationship extraction using large language models
  • Federated graph learning with LLMs
  • Privacy in graph algorithms
  • Privacy preserving graph construction and mining
  • Semantic reasoning based on deep learning on graph
  • Industrial applications of EKGs: banking, financing, retail, healthcare, medicine, etc.
  • Explainable AI based on EKG
  • Use of EKG and LLMs for search and recommendations

Submission

Manuscripts should be submitted in PDF format with 6 pages of content , plus references. Please follow two-column CEUR style template (https://ceur-ws.org/Vol-XXX/) for paper submissions .

Link for paper submission: https://easychair.org/conferences/?conf=ekgllm2023

Camera-Ready Paper Submission and Registration

Authors of accepted papers should prepare a camera-ready (final) version of their paper and submit it using the EasyChair system no later than Sunday, October 1, 2023.  Please email the camera ready version(PDF as well as editable versions (doc/latex)) to rajeev.gupta@microsoft.com , sri@iiitb.ac.in, aparna.m@iiitb.ac.in and bhoomika.ap@iiitb.ac.in.

Each accepted paper requires at least one author to perform in person registration using the link https://uobevents.eventsair.com/cikm2023/cikmauthpreandmain and be presented at the workshop in-person in order to include and publish the paper in the workshop proceedings.

Preparation of Camera Ready Paper

Authors are advised to address the comments of the reviewers in the camera-ready version suitably.

Camera Ready version should be prepared using the two-column CEUR style template (https://ceur-ws.org/Vol-XXX/) and it must adhere to the instructions specified at : https://ceur-ws.org/HOWTOSUBMIT.html#CEURART

1-Day PM Activity Details

Prime Minister PolicyMaker 😁

Time ⏳: 45 mins

Background :

Policymakers are people who are responsible for formulating policies and making policy decisions.  UN has come up with 17 Sustainable development goals across domains with around 167 targets to transform the world. And it is upon policymakers, government officials, researchers, and data scientists to help achieve these sustainable targets by identifying key problem areas and their factors, collecting, processing, and analyzing relevant historic and current data to provide necessary insights to make informed decisions by designing policies for sustainable development.

Karnataka Data Lake is an ongoing project serving as the Data Analytics partner for the Department of Planning and Statistics, Karnataka. 

This activity brings you an exciting opportunity to be a Policymaker for a day

If you’ve made a PolicyMaker for a day 🤔, how do you approach, understand and resolve the problem? 🧐 What policy and budget decisions will you make to build a sustainable society and achieve an SDG target? 🤓

The Task :

The activity requires participants to be divided among groups.

Each group is presented with a problem statement for a region. Considering the data and analysis provided by the KDL site or any other sources, the team should design the policies to help achieve the UN’s Sustainable development target not limited to the below questions but can be based on your expertise.

By the end of the activity, each group should present a case study by performing the below tasks ✅

  1. Explain the problem statement, its relevant SDG Target, and the Karnataka context for the given target.
  2. Investigate factors leading to the problem. Observe if there is a pattern w.r.t the district’s neighboring regions.
  3. If you are given a budget of 20 crores / 2 Million to reach the SDG target for the district. How will you allocate the budget for improving different factors leading to the problem?
  4. Based on your analysis so far, please suggest policies/schemes/action items that help improve the factors affecting the problem sustainably.
  5. Present your case study (ppt or doc) with relevant references, visualizations (optional), dashboards (optional), and datasets (optional) and justify your budget and policy decisions.

(A sample Example is provided for reference purposes.)

References :

Please form groups based on your familiarity with the below SDG Goals. Through this activity, we would love to hear your group’s narratives in solving and achieving the SDG targets not limited to just using the dashboards, but any research papers/reports/news articles/personal or professional expertise.

(*Please note that our volunteers will be around in case of queries or if any help is required to solve/present the problem)

  1. Bidar district is reported to have less Rice production compared to the state’s average
  2. Koppal district has reported having less Wheat production compared to the state’s average.
  1. Vijayanagar district has reported a high IMR compared to the state’s average.
  2. Haveri district reported a high MMR compared to the state’s average.
  3. Kalburgi district reported high U5MR compared to the state’s average.
  1. Vijayanagar district reported high secondary dropouts compared to the state’s average.
  2. Shivmoga district reported high girls’ dropout rate compared to the state’s average.

Opportunities to work with WSL


Jan 2024: Open

Call Code: NSCSPD

Project Name: Designing a Consent Service for Digital Public Infastructures

Digital Public Infastructures (DPIs) democratise access to information and opportunities by providing digital goods and service as a public infrastructure. A key responsibility of DPIs is consent management.

The project involves the design and development of a policy-based consent management service that encodes several applicable regulations like DPDP (Digital Private Data Protection) Act as enforceable rules.

The postdoc researcher is expected to work closely with the rest of the team, to design and develop a reference implementation of a policy-based consent service.

Interested candidates may send their CV along with 2-3 publications, to Prof. Srinath Srinivasa sri@iiitb.ac.in


Aug 2023 : Closed

One Post-doctoral position for 1 year is open, starting from August 1, 2023 for Karnataka Data Lake project : Policy Research using Big Data Analytics (https://kdl.iiitb.ac.in). The position may be extended based on requirement and performance. 

The Key responsibilities include the following :

  • Be the technical interface between the unversity research group and industry sponsor.
  • Work on designing and implementing data pipelines automating ingestion, modeling and visualization tasks.
  • Build conversational AI for KDL considering both structured and unstructured data using Large Language Models.
  • Publish/present findings in research publications and at professional meetings.

Interested candidates may send their CV along with 2-3 publications to sri@iiitb.ac.in.

Jan 2023: Closed

3-month internship in visual analytics and predictive modelling 

Two positions for 3-month paid internships are open, starting January 15, 2023 till April 14, 2023. The positions may be extended for 3 more months based on requirement and performance. 

Internship applicants should have a BTech or equivalent in Computer Science or related disciplines like Information Technology, Data Science, etc. Programming proficiency in python is highly desirable, and experience with visual analytic tools like Tableau or Kibana is an added plus. 

Interns will get an opportunity to work on a major project involving planning and resource allocation, and pick up skills like Bayesian modelling, building data stories and providing actionable insights. 

The internships will come with a stipend of INR 15,000 per month. Applications may be sent to sri@iiitb.ac.in


Dec 2022: Closed

Project Elective applications are open to work on various WSL projects for the upcoming Jan-Apr 2023 semester at IIIT-Bangalore. Students can apply for 4-credit, 12-credit or 20-credit projects as applicable. This call is open to students currently enrolled at IIIT-B.

Applications will close on 2nd Dec 2022. If applied after 2nd Dec, we will reach out to you only in case there are any further open positions.

Project details available here: https://drive.google.com/file/d/1So1fm1Zeu0aaZHGQMC_vWd2efaRLvoko/view?usp=sharing

Form to apply: https://forms.gle/Cy8SzNNp5Y3szhy79

WS4D Datathon: Concept and Details

Concept Note for the SafeCity Data Visualisation Challenge

WS4D Datathon http://cognitive.iiitb.ac.in/ws4d-datathon-and-phd-colloquium/

Data:

The key dataset(s) pertain to information gathered from India, and provided by the Red Dot Foundation.

  1. Reports: time, place, type of event, report
  2. MobileApp: time, place, type of event

Reference articles https://safecity.in/publications/research-papers/  pertain to the following topics:

  1. Use of ML/AI to find the type of event (touching/groping/sexual invites/commenting/etc.) from the reports; a study on the diverse forms of sexual harassment
  2. Street violence
  3. Gender-based violence in public transport
  4. Women’s strategies to address assault and violence
  5. Study of crowdsourced data

Challenge themes:

The following points are for processing data and analyzing it deliberately, and using the knowledge to create a compelling visualization as a narrative/summary (preferably) or a tool.  The visualization (tool) must be shareable on social media to spread awareness and to inspire action against gender-based violence and others.

  1. Theme-Mythbusters: Time-related clustering/visualization or integration of time (time of day, evolution over time) with spatial and categories of crime – ( http://maps.safecity.in/ ): This will help us debunk the myths of where and when different kinds of sexual violence tend to take place. Hence, the challenge starts with picking/identifying a myth as a hypothesis, and demonstrating if the data confirm it or not. 
  2. Theme-MirrorMirrorOnTheWall: Comparison of Indian cities with others in the world where data is available: this will give us a sense of India’s position in sexual violence across different parameters captured in the existing datasets. For example, do we see a concentration of specific kinds of violence in India? Such data help us make aware of specific social structures within which sexual crime takes place. 
  3. Theme-Mash-up: Integration with other relevant datasets — police data, sex ratio, etc. available for a specific city. This will help us understand the overall situation of the safety and status of women in a city.  Such data will be crucial in shaping institutional strategies for coping with the incidence of sexual violence.  

For Theme-MythBusters, relevant myths (as a sample):

  1. Gender-based violence of all forms is highly prevalent in Delhi.
  2. Gender-based violence occurs in dimly lit streets and at night.
  3. Sexual violence and harassment occur only in very crowded or very deserted regions.
  4. Not many women get distressed with non-physical forms of violence.

For Theme-MirrorMirrorOnTheWall, relevant datasets and sources:

  1. https://evaw-global-database.unwomen.org/en/countries
  2. New York City crime: https://data.cityofnewyork.us/Public-Safety/NYC-crime/qb7u-rbmr
  3. Country and World data: consolidated as an excel sheet by Red Dot Foundation using multiple sources: http://worldpopulationreview.com/countries/rape-statistics-by-country/

https://data.oecd.org/inequality/violence-against-women.htm

https://data.gov.in

For Theme-Mash-up, relevant datasets and sources:

  1. social indicators: the general status of women in a specific city, for example, sex ratio, gender-segregated literacy rates, rate of female workforce participation. 
    1. Demographics data with gender segregation – raw data: http://censusindia.gov.in/2011census/population_enumeration.html
    2. Report: Women and Men in India:
      1. 2017: http://www.indiaenvironmentportal.org.in/files/file/women%20and%20men%20in%20India%202017.pdf
      2. 2018: http://www.mospi.gov.in/sites/default/files/publication_reports/Women%20and%20Men%20%20in%20India%202018.pdf
    3. http://www.mospi.gov.in/statistical-year-book-india/2017/171
    4. https://data.gov.in/search/site?query=gender
    5. Districtwise Education Data 2015-16 based on sex ratio, male/female literacy, schools by category, boys/girls schools by category, male/female teachers by category, etc.
    6.  Rural Female broad employment status
    7. Urban female broad employment status
    8. Women prisoners with children
    9.  Statewise schools with female teachers
    10. Statewise registered cases against stalking, rape, acid attacks
    11. Financial assistance provided to OBC women
    12.  Budgetary allocation for women safety
    13. State level literacy rate
  2. infrastructure indicators: the general state of law and order, safety in public spaces, gender-based crime, street lights, CCTV cameras, etc.
    1. Street lighting: https://data.gov.in/resources/stateut-wise-no-led-street-lights-installed-under-street-lighting-national-programme-slnp
    2. Crime against women:
      1. https://data.gov.in/catalog/crime-committed-against-women?filters%5Bfield_catalog_reference%5D=86920&format=json&offset=0&limit=6&sort%5Bcreated%5D=desc
      2. https://data.humdata.org/dataset/crime-trends-and-operations-of-criminal-justice-systems-un-cts-sexual-violence
      3. Crime against Women in Metropolitan Cities — tables from a book chapter. [provided separately as a pdf].

Deliverables:

A compelling visual narrative to be shared on social media:

  1. Appropriate fonts and color palettes
  2. Situation-sensitive text, e.g. without victim shaming
  3. Use of popular NLP tools in python, visualization tools like D3.js, Tableau, etc.

For further queries: datathon2020@iiitb.ac.in