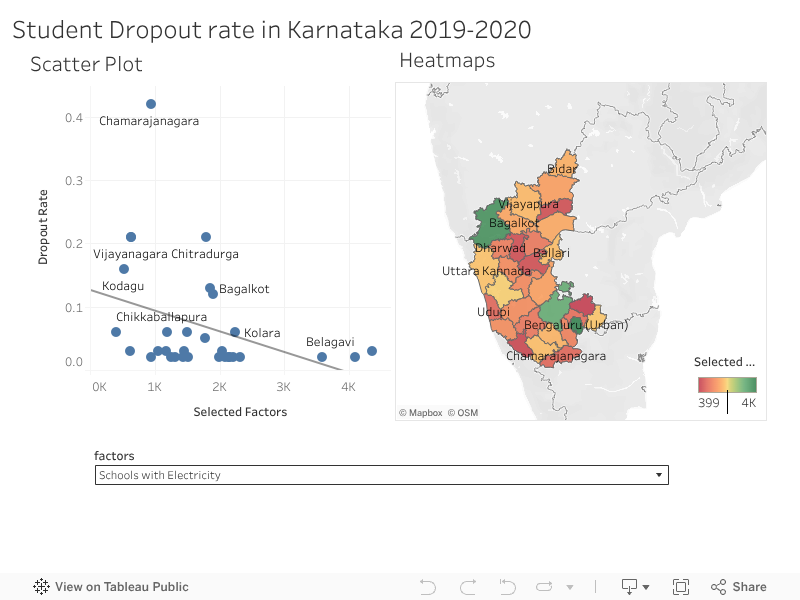

This dashboard visualizes the relationship between student dropout rate and influencing factors using two key visual tools. The scatter plot illustrates the correlations between dropout rates and specific variables such as infrastructure, or teacher-student ratio, etc. The heatmap highlights how contributing factors vary across various regions in Karnataka. Together, these visuals help identify critical patterns and areas needing intervention.