
Understanding the Web


NITI for States is an initiative under NITI Aayog that aims to strengthen the capacity of Indian states and union territories to drive effective governance, improve development outcomes, and accelerate progress toward national development goals. The State Support Mission (SSM) acts as a collaborative platform that offers technical assistance, data-driven decision-making support, institutional strengthening, and policy advisory services tailored to each state’s unique development context. It promotes evidence-based planning, innovative best practices, and state-level implementation frameworks aligned with national priorities. The SSM has several institutional components to facilitate implementation including designating Lead Knowledge Institutes (LKI) to provide domain and technical support.
IIIT-B has been nominated as a Lead Knowledge Institute under State Support Mission to promote evidence-based policy interventions using data science. Engagement with LKIs includes providing knowledge support to various SSM initiatives through research studies, organising workshops, trainings, seminars or any other technical support as required by NITI Aayog for the implementation of the mission.
To know more, visit the website https://lki-ssm.iiitb.ac.in/
Uttar Pradesh 2023-24 Secondary Dropout Rate
All India State Dropouts 2023-24
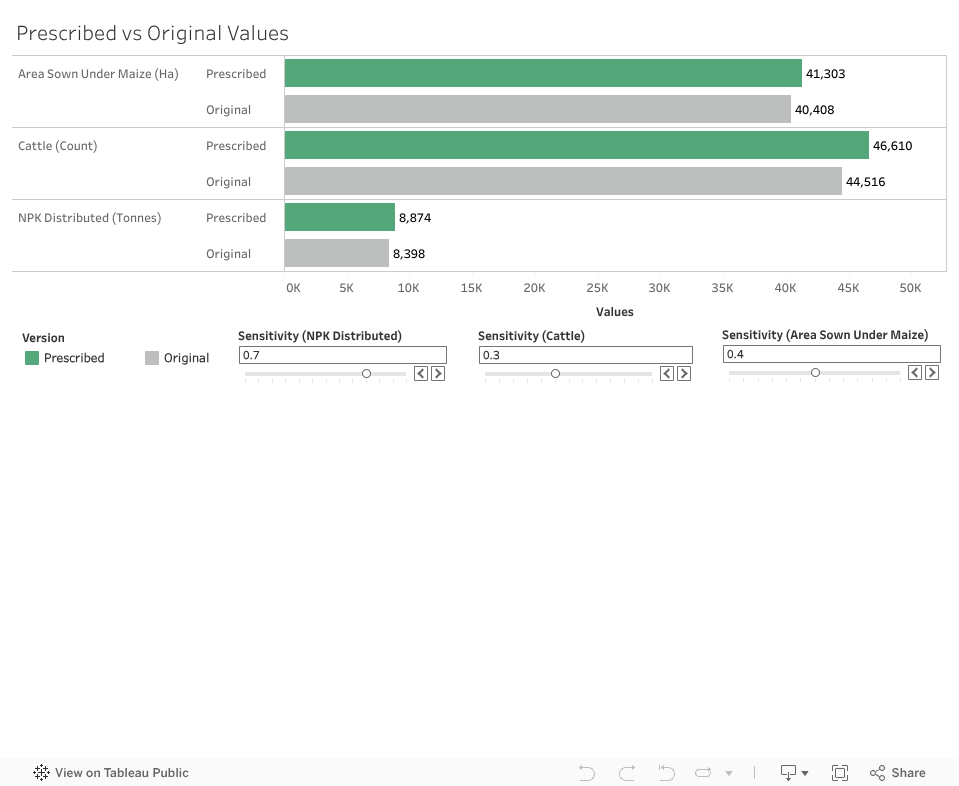
Uttar Pradesh 2023-24 Prescriptive Dashboard
Alumni
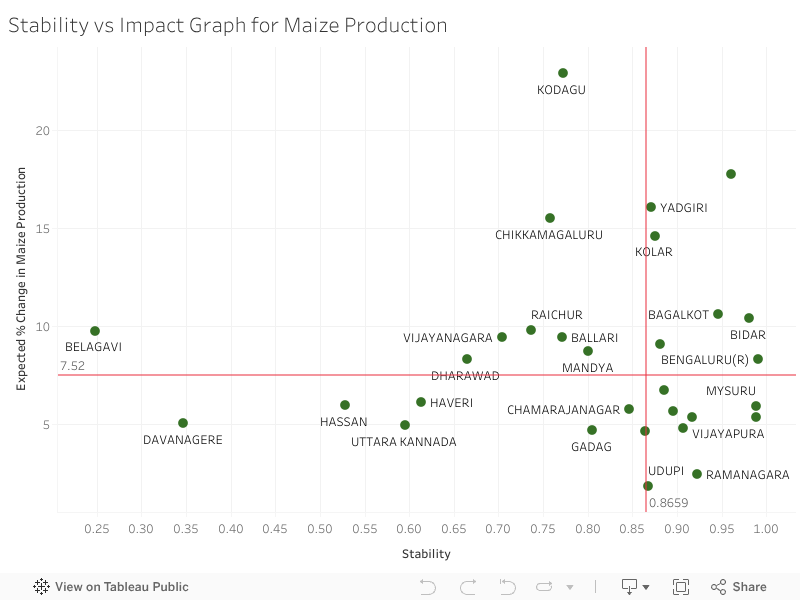
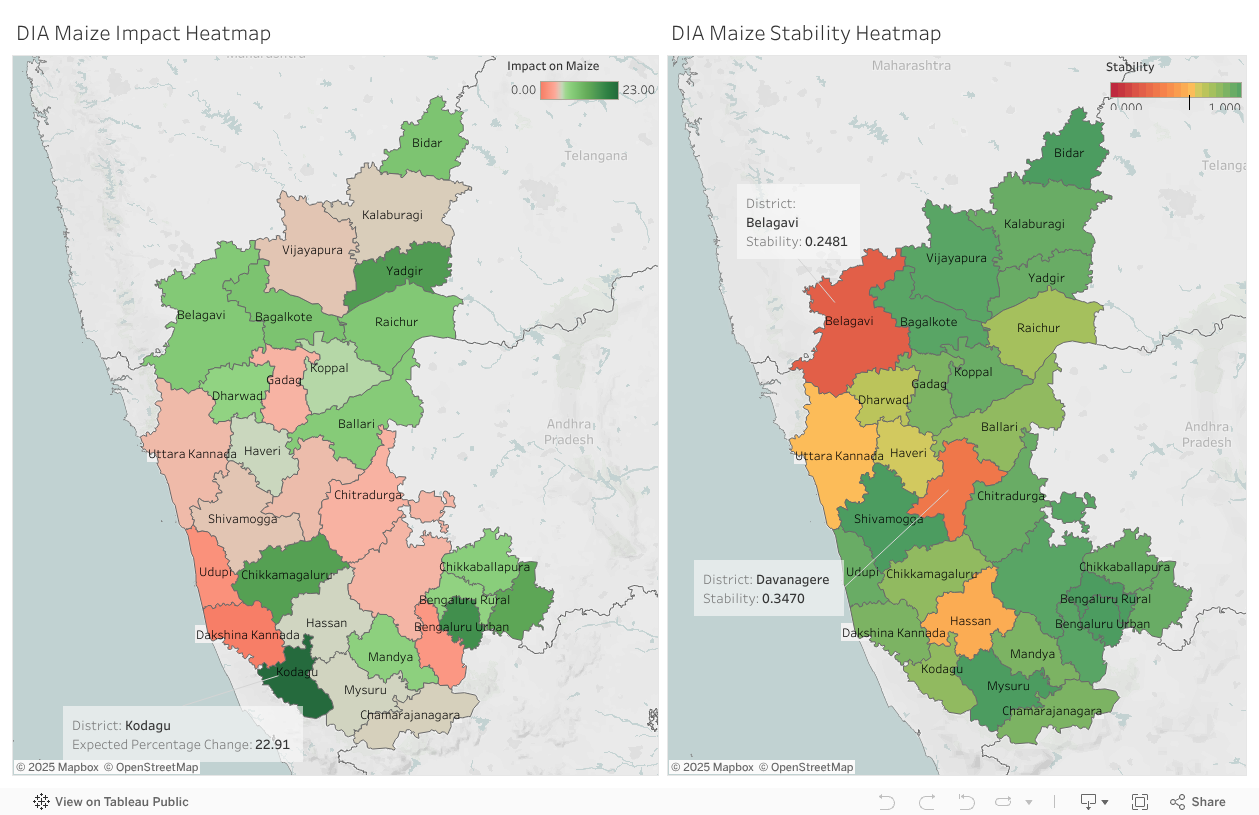
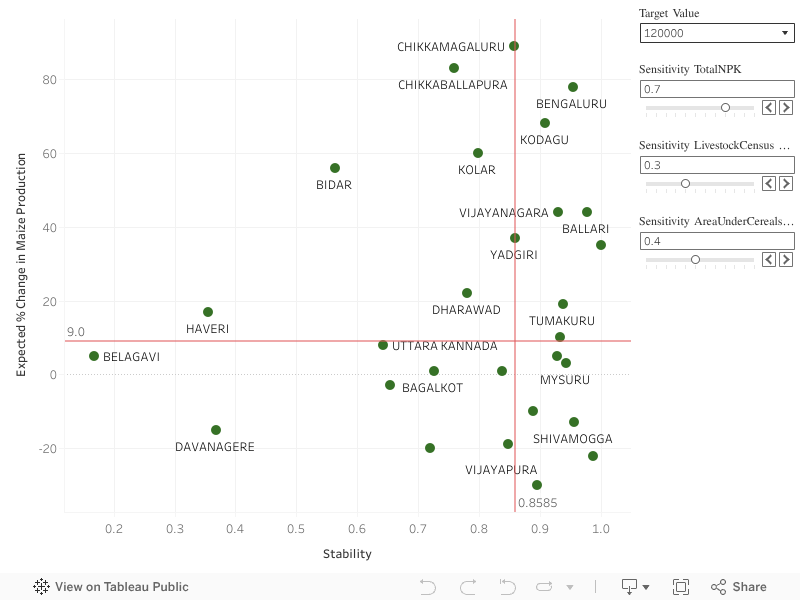
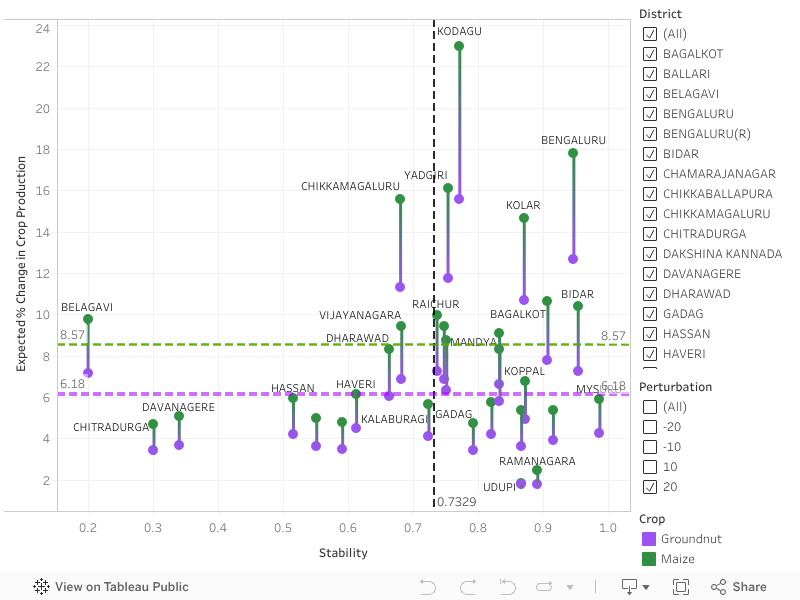
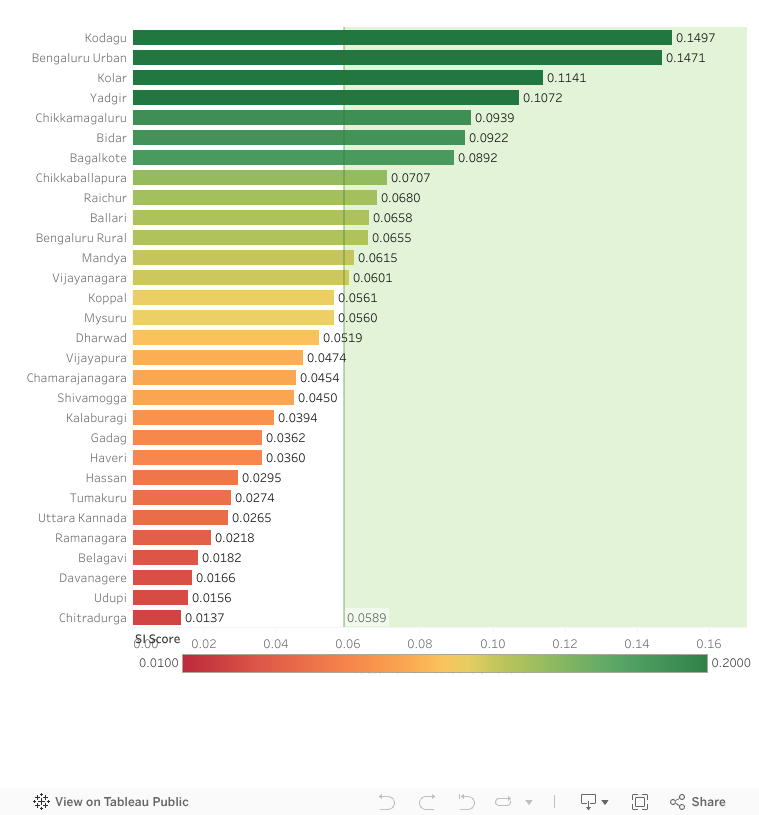
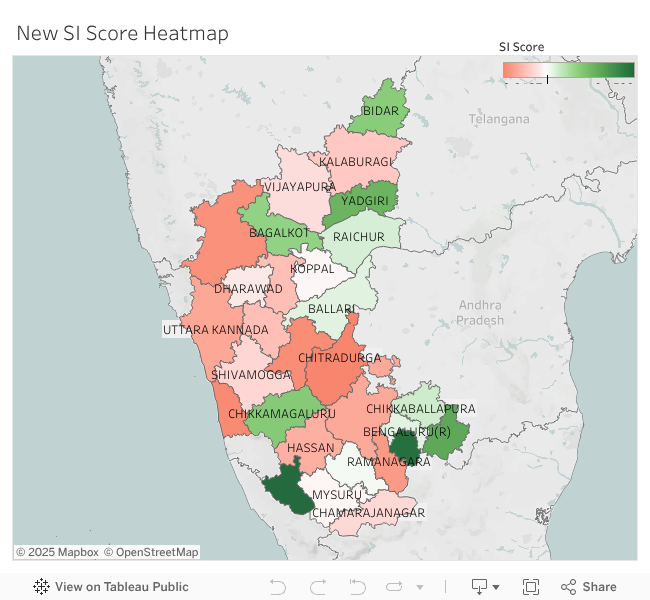
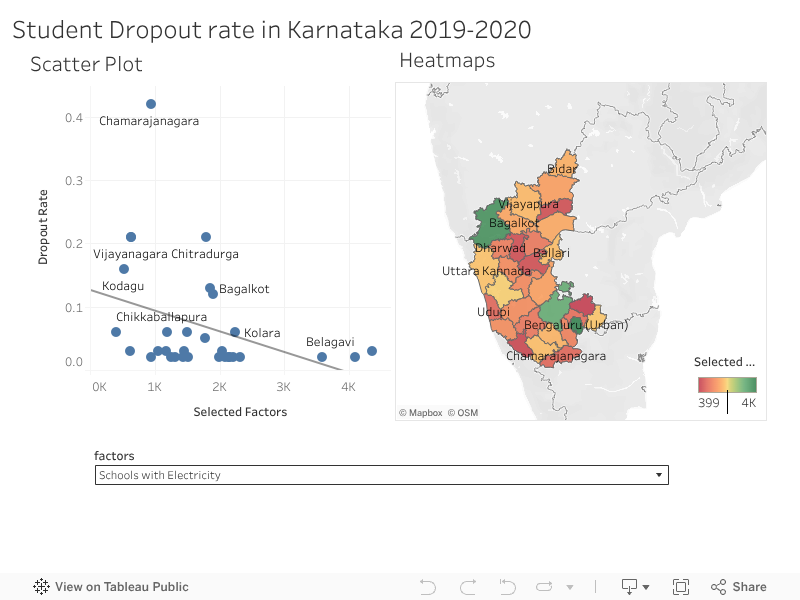
This dashboard visualizes the relationship between student dropout rate and influencing factors using two key visual tools. The scatter plot illustrates the correlations between dropout rates and specific variables such as infrastructure, or teacher-student ratio, etc. The heatmap highlights how contributing factors vary across various regions in Karnataka. Together, these visuals help identify critical patterns and areas needing intervention.
You can select the variable for which you want to see correlation with wheat yield, from the dropdown menu.
If the p-value for a variable is less than 0.05, then that variable has a significant correlation with wheat yield.
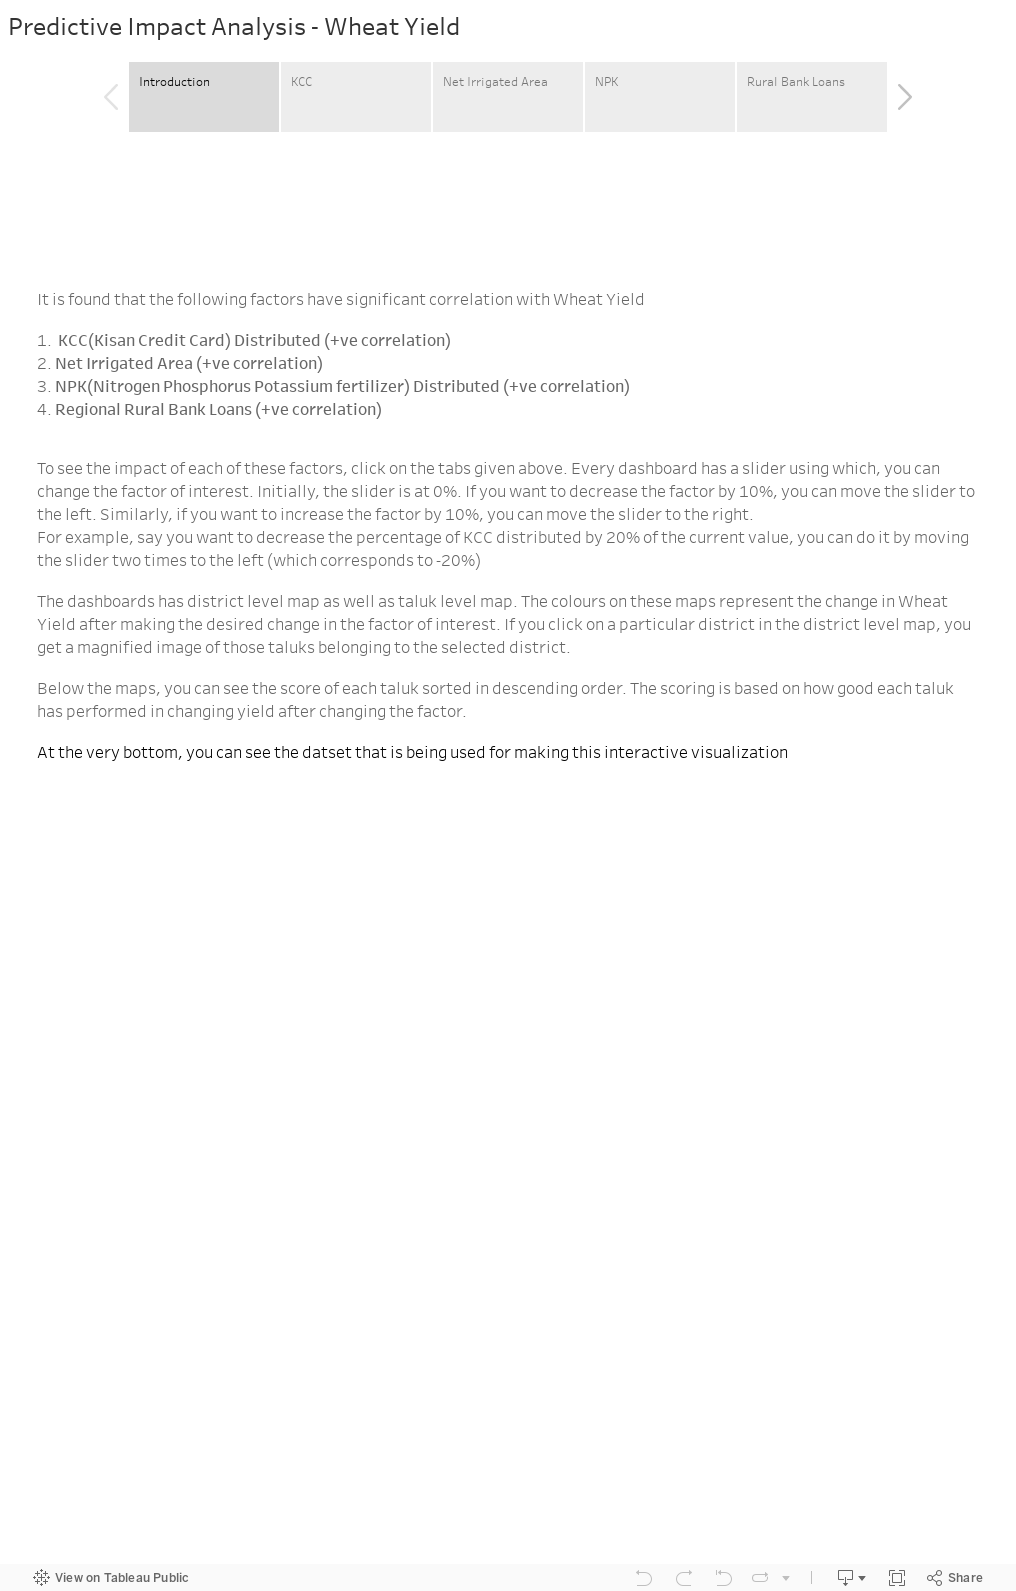
It is found that the following factors have significant correlation with Wheat Yield
1. KCC(Kisan Credit Card) Distributed (+ve correlation)
2. Net Irrigated Area (+ve correlation)
3. NPK(Nitrogen Phosphorus Potassium fertilizer) Distributed (+ve correlation)
4. Regional Rural Bank Loans (+ve correlation)

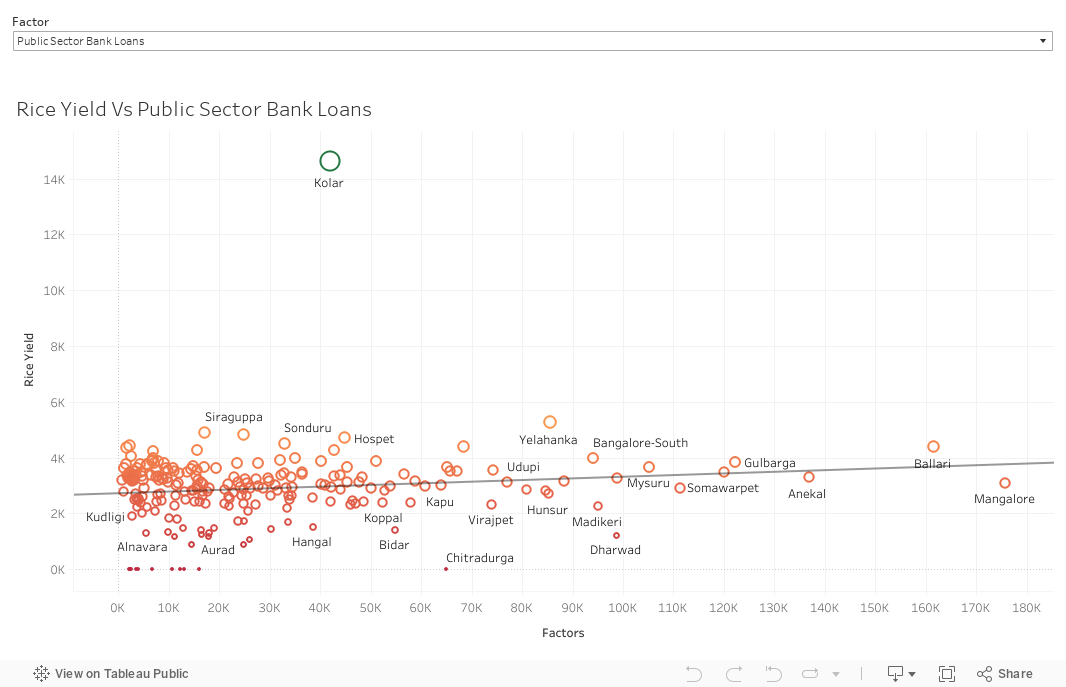
You can select the variable for which you want to see correlation with rice yield, from the dropdown menu.
If p-value for a variable is less than 0.05, then that variable has significant correlation with rice yield.
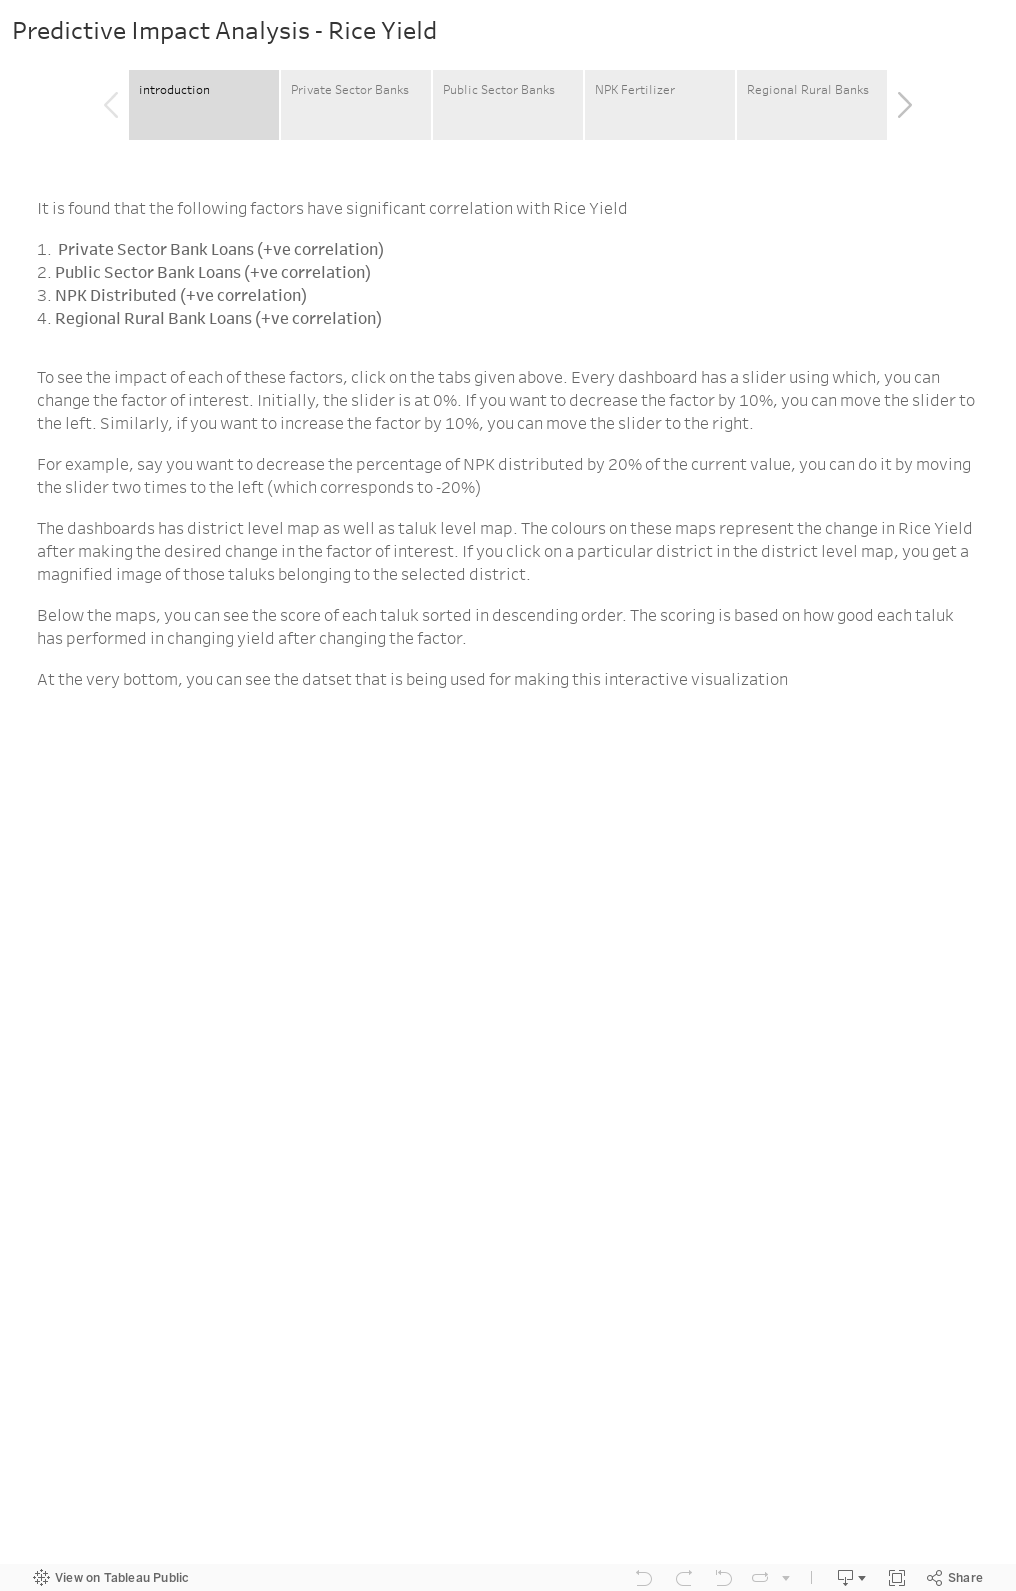
It is found that the following factors have significant correlation with Rice Yield
1. Private Sector Bank Loans (+ve correlation)
2. Public Sector Bank Loans (+ve correlation)
3. NPK Distributed (+ve correlation)
4. Regional Rural Bank Loans (+ve correlation)